Embed a statistical map
Integrate rich interactive statistical maps into your web portal. Get a user-friendly and simple information effect for deeper data perception and understanding.
Example from Géoclip "France découverte"
Interactive map
The map is fully interactive. You can zoom in and out, pan around your area, hover over geographical units, change indicators, etc.
Adjust the representation mode
Refine your thematic analysis by changing the colors, number of classes, discretization methods, size of symbols, etc.
Choose an area
Focus on a specific area in one click, and expand it if necessary.
Embed charts
Select a couple of relevant graphics in your Geoclip application and allow users to discover and interact with the data visualizations.
Easy access to charts
Discover perfect data representation modes, appropriate choices of colors, suitable scales and vector-quality drawings.
Interactive charts
The individual values are displayed when you move the mouse over the chart. Choose another time period in the timeline or enjoy the automatic animation of the chart according to the different periods.
Reuse of data
Export graphics in different image formats or retrieve statistical data.
Explore a selected set of territorial data according to different themes on a couple of major cities. Interact with the form to better understand the topics.
Wishing this on your own website?
You are a Géoclip administrator and you wish to provide your users with easy access to more and more territorial data? Boost your portal with modern data representation modes using the quality and accuracy of Géoclip.
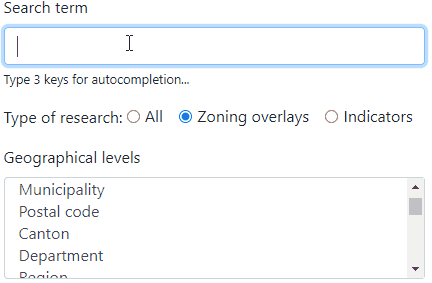
Search for an area or an indicator
Allow your users to mark their zones. Type in a few letters, the Géoclip API will autocomplete and adjust the zone according to the geographical levels. Or maybe you'll rather search for a particular indicator?
Auto completion
Suggest zones based on their relevance to speed up the search for zones by your users.
Database search
The search form automatically interacts with Géoclip to obtain the most recent data.
Embed a full dataviz item
Gather some data visualizations to access chart compositions on a given theme in order to better understand the challenges or issues.
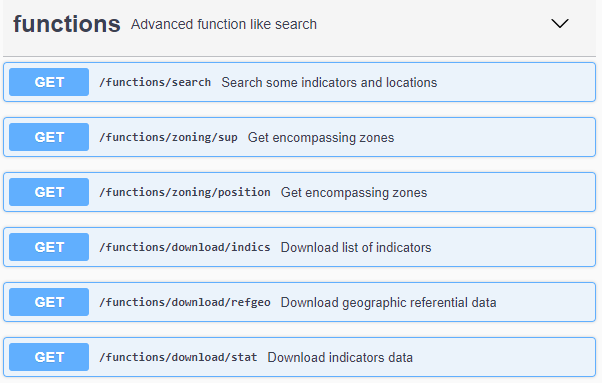
API Swagger Documentation
Standardized Swagger Server REST API documentation is available to discover, understand and live test the structure of the data provided. The server REST API provides access to a set of ready-to-use services:
API Metadata services
Request our Géoclip API to get plenty of metadata. Get themes, datasets, geographical data, etc. Try by retrieving the list of indicators for a given theme:
Get the json flags of the "pop - Population" theme
API zoning services
Get the list of enclosing zonings in JSON format from a geographic unit code or a geographic coordinate
API download
Download the statistical data of indicators according to the different geographic levels. Try by retrieving data about population density by municipalities.
Create your own dataviz
An entry point for the Géoclip API allows you to obtain ready-to-use tools to create your own visualizations with your favorite tools (R, D3JS, etc.) and adopt the styles that suit you.
Distribution of municipalities in the selected department
JSON data ready:
Portfolio
Organize your indicators according to categories and display them by automatically generated thumbnails in attractive web components. Hover the indicator then download the data in Excel format or map the indicator on the rich app.
- All
- Typology
- Ratio/Rate
- Symbols
Services
Several support services are offered to allow you to be autonomous in the Géoclip API processing on your own web portal
Training course
Learn how to use the Geoclip API from your website. We offer dedicated training sessions led by our Géoclip experts.
Support and maintenance
Questions or advice to configure your statistical map or chart? We have a platform to open a support ticket.
Documentation
Clear and educational documentation is available to get to familiarize with our API.
Basic Examples
Simple code examples to get beautiful statistical mapsor chart representations in minutes.
Rich examples
Richer compositions highlighting more advanced features are proposed and documented.
References
Discover a real Web portal using the Géoclip API in production.
Contact
Should you wish to learn more, please do not hesitate to contact us.
49 Avenue Albert Einstein - BP 12074
69100 Villeurbanne CEDEX France
contact@cirilgroup.com
+33 (0)4 72 69 16 80